
In the fast-paced realm of SaaS business, every choice matters. You can have a stellar SaaS product, but without effective SaaS reporting, it’s hard to track your recurring revenue, monitor your churn rate, or see where your marketing campaigns might be underperforming.
At VH Info, we’ve seen how consistent analysis of critical metrics can make the difference between high churn and sustainable revenue growth. Focusing on accurate data, total revenue insights, and user behavior patterns can help SaaS companies uncover game-changing opportunities.
This article dives into how to set up your reporting, which important metrics to track, and the best practices for turning raw data into actionable insights.
What is SaaS Reporting?

SaaS reporting is the structured process of collecting, analyzing, and presenting information about key metrics in a software-as-a-service environment.
It deals with monthly recurring revenue (MRR), annual recurring revenue (ARR), customer lifetime value, and other items that help you assess your business performance.
Essentially, any SaaS report involves looking at the total number of paying users, evaluating how well marketing efforts convert potential customers into new customer sign-ups, and measuring the revenue growth over a specific period.
Beyond measuring broad financial metrics like the total amount of money earned, it also helps with deeper insights into user engagement, customer behavior, and the success of different marketing strategies. SaaS analytics typically includes data from multiple sources, such as payment systems, CRM tools, and web analytics services like Google Analytics.
That consolidated view influences strategic decisions on everything from acquisition costs to product improvements.
Why is SaaS Reporting Important For SaaS Companies?
- Informs Decision-Making: Accurate reporting provides clarity on metrics such as churn rate, conversion rate, and average revenue per account. A high churn rate signals a product or service issue while analyzing churn in detail can reveal trends in your customer base that you can address. If you want to reduce acquisition costs or adjust pricing, SaaS analytics shines a light on both short-term and long-term consequences.
- Aids Forecasting and Budgeting: Financial metrics like annual recurring revenue (ARR), monthly recurring revenue (MRR), and total revenue trends highlight your cash flow trajectory. Along with your average purchase value, average customer lifespan, and conversion rate, you can see how much you’ll earn over a given period and plan your sales expenses. Forecasts serve as strong guides for resource allocation, enabling better planning for marketing strategies or expansions.
- Updates Stakeholders: Whether you’re tracking the total cost of operations or the customer lifetime value relative to the customer acquisition cost, a well-structured SaaS report can streamline communication with internal teams, investors, and executives. Everything from net promoter score to average revenue per user helps investors gauge whether the business objectives are on track.
- Optimizes User Experience: SaaS reporting reveals user behavior and customer interactions that might otherwise remain hidden. You might recognize that a certain feature has high usage but is causing friction in the sales funnel. This data can guide improvements in customer success strategies to support your target audience more effectively.
- Identifies Growth Opportunities: Accurate reporting helps zero in on the number of customers who upgrade. It also tracks overall user engagement, including the possibility of upselling or cross-selling. Observing revenue growth patterns reveals where new spikes of potential customers are emerging, helping you refine marketing campaigns, product roadmaps, or both.
How to Get Started With SaaS Reporting?
Starting with SaaS reporting can feel overwhelming. However, having a clear plan can make it easier and very beneficial.
Decide On The Scope Of Your Reporting
Determine whether you’ll focus on a specific period for tracking, such as a monthly or quarterly view of your churn rate and total revenue.
Clarity about your time frame simplifies data gathering. A short time frame may help you monitor recent marketing efforts, while a longer one is better for spotting lower-frequency patterns like user engagement declines that lead to high churn.
Decide On The SaaS Reporting Metrics You Want to Track
Pick critical metrics that align with your business goals.
For instance, if you need to reduce acquisition costs, then the customer acquisition cost metric sits at the top of your list. If you aim to pinpoint whether you have a profitable customer base, you may prioritize monthly recurring revenue and revenue growth.
Focusing on the right data will help you avoid drowning in numbers that don’t move the needle.
Use An Omnichannel Approach to Have Multiple Data Sources
A robust SaaS report involves data from CRM platforms, subscription billing systems, support tickets, and website analytics solutions such as Google Analytics.
Combining data from each data source yields accurate reporting that can reveal correlations between the sales funnel and product usage. With multiple inputs, you end up with more accurate data and fewer blind spots in the process.
Choose a Reporting Software to Collect Data
Countless reporting tools software exist for SaaS analytics, each with distinct key features. Some integrate seamlessly with Google Sheets, while others configure the entire pipeline with advanced predictive analytics.
Consider cost, user interface, and how well a particular reporting tool aligns with your business objectives. If you’re motivated to set up customizable dashboards for real-time viewing, confirm that the solution offers that capability.
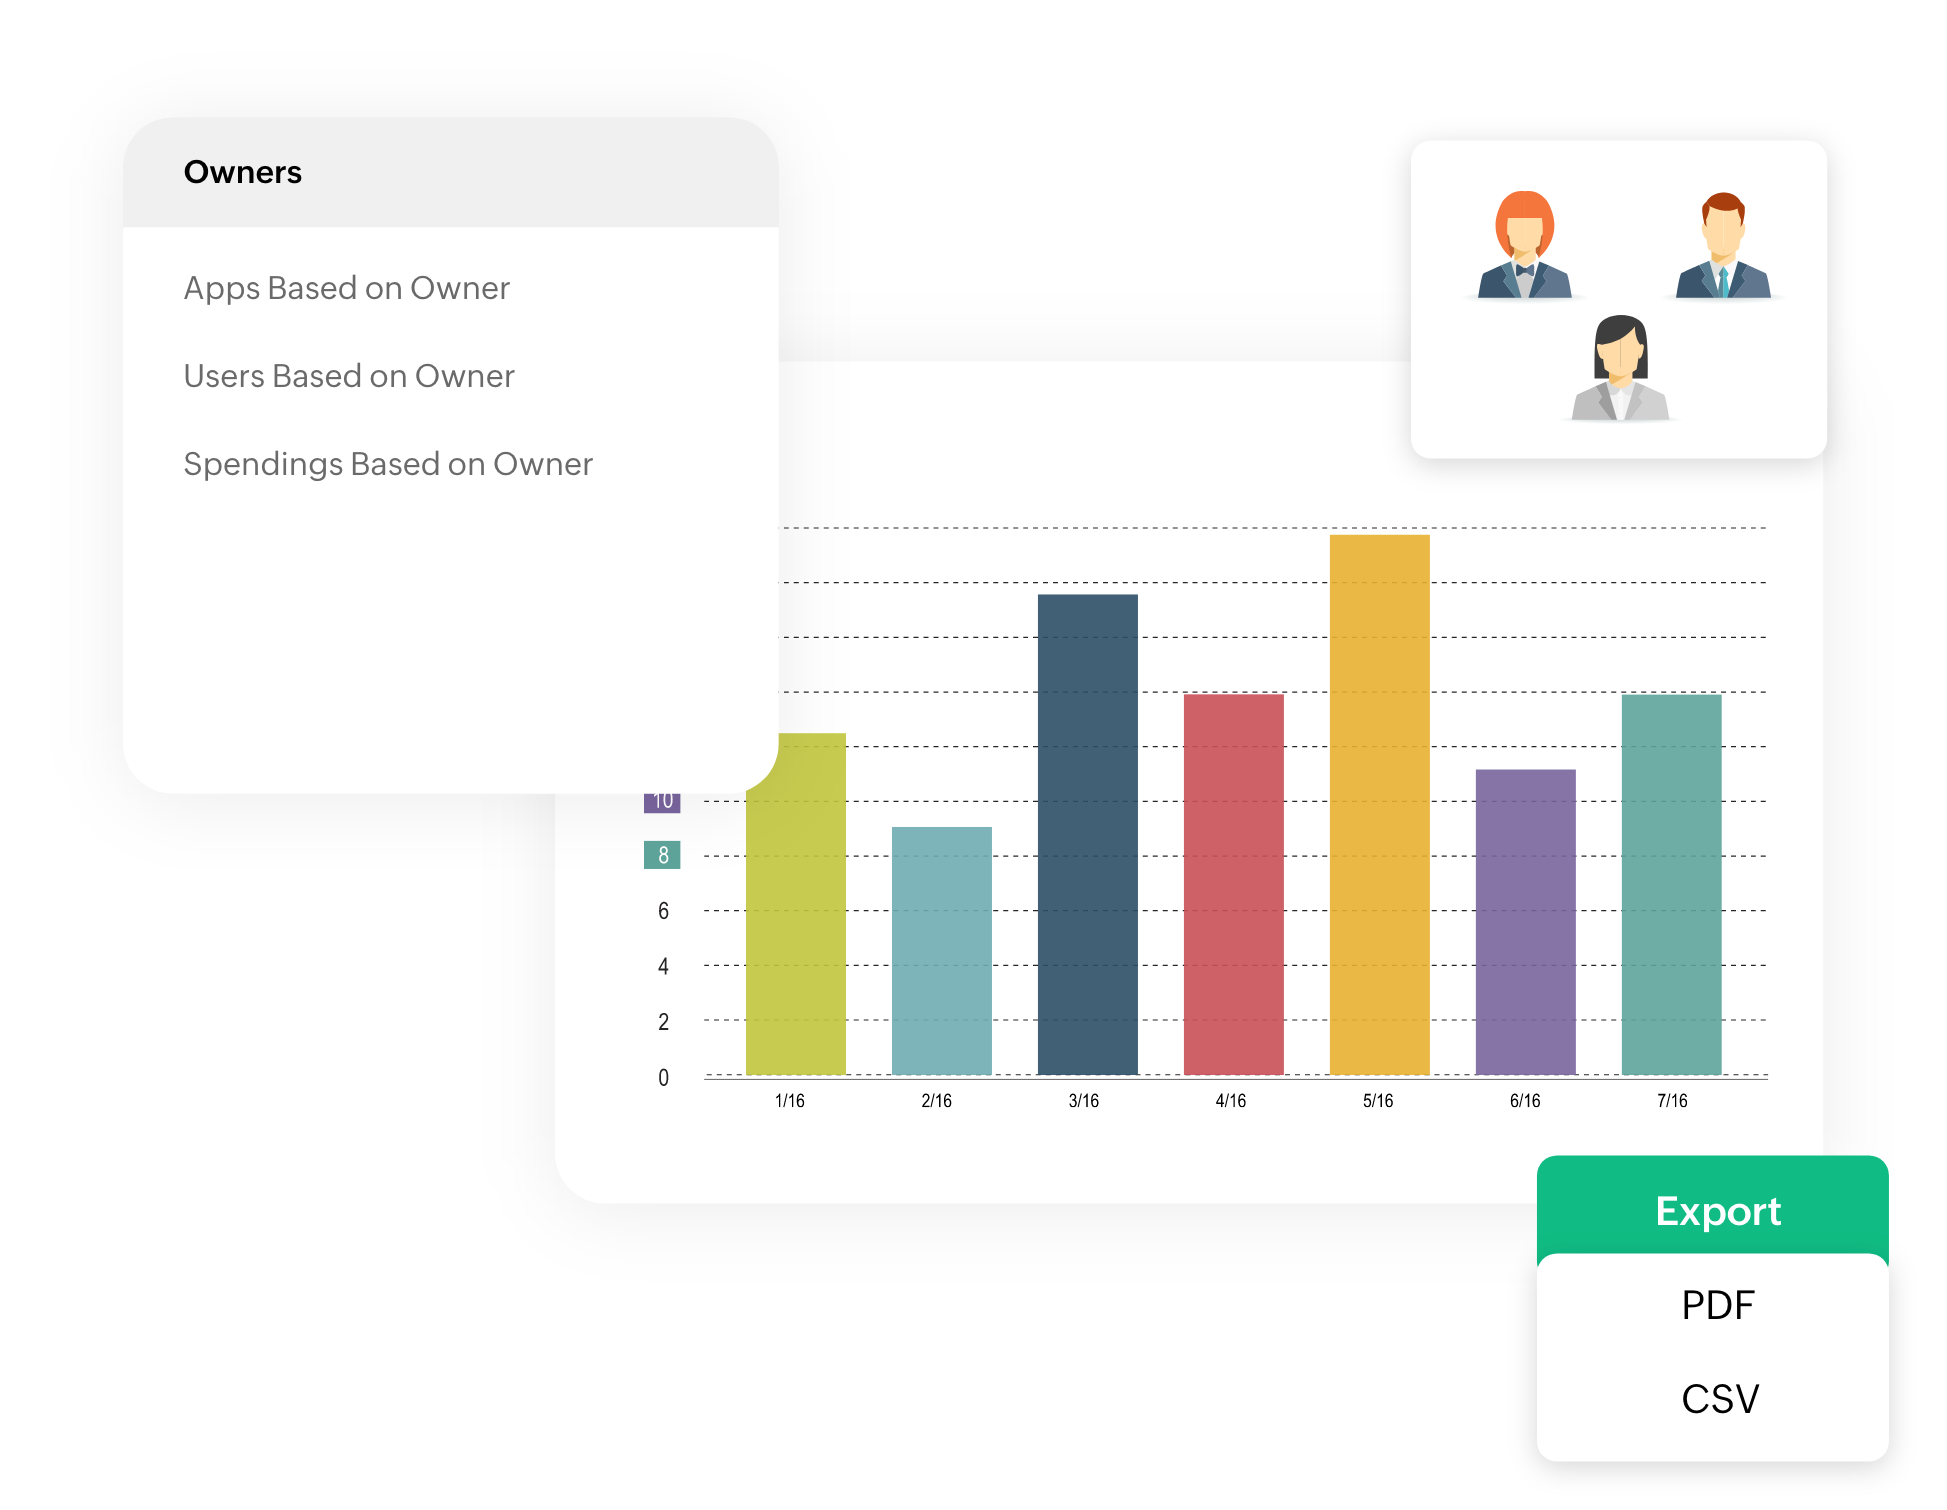
Visualize Data With Interactive Dashboards
Data visualization goes well beyond static charts. Customizable dashboards allow you to see monthly recurring revenue patterns side by side with marketing campaigns or time frame comparisons.
Interactive features—such as the capacity to drill down into raw data—make it easier to derive actionable insights. Color-coding user engagement or labeling top acquisition sources can highlight pressing issues at a glance.
Key Metrics to Track in SaaS Reporting
SaaS companies use different metrics to check their performance. Tracking the right metrics is important for getting useful business insights.
Customer Acquisition Cost (CAC)
CAC measures the total cost involved in attracting a new customer. It includes marketing expenses, sales expenses, and any overhead dedicated to acquiring that user.
Divide your total acquisition spending by the number of new sign-ups in a specific period to figure out your CAC. Compare it with your customer lifetime value to see whether your sales funnel is profitable.
Customer Lifetime Value (CLV)
Customer lifetime value (CLV) puts a dollar figure on how much the average user pays throughout the entire average customer lifespan.
Calculating this metric involves the average purchase value, the conversion rate of upsells, the likely total number of months or years they remain active, and the presence of recurring revenue.
If CLV is lower than acquisition costs, that indicates a flawed business model or high churn.
Monthly Recurring Revenue (MRR) and Annual Recurring Revenue (ARR)
MRR and ARR both demonstrate recurring revenue for your SaaS business.
MRR is popular for short-term insights, while ARR is great for a bigger-picture approach. Tracking MRR helps measure small fluctuations in any given period, while ARR is useful for forecasting if you prefer annual snapshots.
Both highlight the stability of your income stream from the current customer base.
Churn Rate
The churn rate is the percentage of customers who cancel or fail to renew over a time frame. High churn can stem from product issues, poor onboarding, or ineffective marketing strategies.
In many SaaS companies, even a small rise in churn can undermine revenue growth. Tracking churn rate monthly or quarterly reveals whether changes in feature sets or pricing address underlying problems.
Conversion Rate
Your conversion rate determines the percentage of potential customers who become paying accounts. Evaluating your conversion rate can highlight bottlenecks in usability, messaging, or the marketing funnel.
Often, a strong conversion rate results from a well-targeted offering and a clear path to subscription within your website or app.
Retention Rate
The retention rate is the counterpart to the churn rate. High retention indicates your product is valuable enough for users to keep paying.
This metric ties directly to healthy recurring revenue and a stable customer base. If you lack robust retention, your average revenue might rely too much on short-lived sign-ups.
Revenue Growth Rate
The revenue growth rate tracks how much your total revenue increases from one specific period to another. It helps you identify trends in your sales funnel, marketing campaigns, and potential changes in user behavior.
An accelerating growth rate suggests your marketing efforts are working, while a slowdown might reflect an increase in competition or insufficient product evolution.
Net Promoter Score
NPS is a measure of overall satisfaction, derived from survey responses to the question: “How likely are you to recommend us to a friend?”
A high NPS often corresponds to lower churn, better customer interactions, and strong word-of-mouth marketing. Include NPS in your reports to gauge brand loyalty.
Customer Satisfaction Score
CSAT is a simpler measure of customer satisfaction with a product or feature.
By checking CSAT across various touchpoints, you can see if dissatisfaction is concentrated in a specific area. Monitoring this can help reduce churn rate, boost user engagement, and improve the overall customer success experience.
Activation Rate
Activation rate looks at how quickly and effectively your new customer is onboarded. A poorly executed onboarding process might result in a user failing to see the product’s value, leading to a high churn rate.
Track activation to improve your initial user experience and keep new accounts from leaving.
Types Of SaaS Reports
SaaS reports come in different types. Each type gives valuable information about different parts of a SaaS business.
Financial Report
Financial reports revolve around revenue data, including monthly recurring revenue, annual recurring revenue, average revenue per user, and the distribution of your total revenue. Using the best financial reporting software can help organize and analyze these figures more efficiently, ensuring accuracy and clarity in decision-making.
This set of documents details whether the amount of money earned over a given period meets expectations, how much cash flow you have, and if your overall finances are stable enough to invest in growth.
Product Usage Report
A product usage report reveals user behavior, showing which features get used, how frequently customers log in, and at what point they might experience friction.
This helps you identify if there are hidden barriers or inefficiencies hurting user engagement or leading to an unexpected churn rate.
Customer Success Report
A customer success report ties metrics like net promoter score, customer satisfaction score, and retention rate into a single snapshot. It monitors whether your support or product enhancements have improved the overall customer experience.
This is also helpful if you’re attempting to strengthen brand loyalty as part of your strategic decisions.
Sales and Marketing Report
Sales and marketing reports highlight your marketing campaigns, cost per lead, customer acquisition cost, and conversion rate results.
They verify whether your marketing efforts are attracting the right target audience and where your leads drop off in the sales funnel. They also monitor whether your marketing strategies effectively reach potential customers.
Support and Service Report
Support and service reports analyze incoming requests, resolution times, and user feedback. You can tie them closely to your customer interaction metrics (like CSAT scores).
Ensuring timely resolution of problems reduces frustration, aids retention, and can ultimately elevate your total revenue.
Challenges in SaaS Reporting and How to Overcome Them?

SaaS reporting gives important insights, but it’s essential to deal with challenges to use it fully.
Data Accuracy Issues
When your data comes from multiple sources (CRM, payment processors, or marketing platforms), small discrepancies can lead to big confusion for your entire SaaS analytics approach. Inaccurate data skews any conclusion about churn rate or conversion rate.
Ensure that everything is standardized and validated so you can rely on accurate reporting. You might also deploy automated scripts to remove duplicates and confirm your raw data matches your expected format.
Overwhelming Amount of Data
Having too many metrics can be as unproductive as having none.
A typical SaaS business can track user engagement, MRR, high churn rate, average purchase value, and more, yet not all of these are equally valuable for your business goals. Identify only the critical metrics that align with your strategic decisions, and focus on them. Less is more when you want clarity on your best path forward.
Lack of Technical Expertise
Some reporting tools are more intuitive, while others demand advanced knowledge of data engineering or predictive analytics.
If your team doesn’t have the required people with years of experience in analytics, consider software that offers a user-friendly interface with customizable dashboards and a robust knowledge base. Alternatively, seek external partners who can help you set up a streamlined system.
Best SaaS Reporting Tools
Numerous tools can collect and visualize data from different data sources. Each has key features designed to handle distinct use cases.
Below is a brief look at some popular ones.
Userpilot

Userpilot is a powerful platform for saas reporting. It helps you track churn rate and measure customer lifetime value in real-time. The software allows you to examine your conversion rate to identify friction points and boost average revenue from your user base.
Many saas companies rely on it to maintain recurring revenue by gathering feedback through in-app surveys. Its in-app analytics present detailed snapshots that highlight what drives user satisfaction and where product-led adjustments can keep customers from leaving.
This kind of deep insight allows product teams to move confidently and refine features to match user expectations.
Hubspot

HubSpot offers dashboards that measure monthly recurring revenue and track revenue growth. It also supports workflows that focus on customer retention throughout your saas business, making it easier to spot patterns in total revenue.
By following user behavior at each funnel stage, the platform reveals trends in the number of customers who convert to your pages. You get the convenience of logging every interaction in a single environment, so your team always has the right data to adjust messaging or pricing.
HubSpot’s CRM integrates naturally with marketing tools and gives you a straightforward way to keep your pipeline organized.
Databox

Databox serves as a centralized solution to track customer acquisition costs and spot areas with high churn.
Its broad integrations span multiple marketing strategies, unlocking a simple view of annual recurring revenue so you can compare progress across a saas report during any specific period.
Automated alerts notify you when customer success benchmarks need attention, giving you the flexibility to pivot tactics early.
The data unification capabilities also reduce guesswork, letting you visualize how each metric contributes to company-wide performance. For leaders seeking clarity on why churn spikes or dips, Databox brings helpful details to the surface.
Looker Studio

Looker Studio stands out as a reporting tool that consolidates raw data from multiple locations, including details on marketing campaigns and critical metrics, into dynamic dashboards.
Teams transform those numbers into actionable insights that guide each new customer toward activation.
Its user-friendly layout allows you to shape important metrics around your core objectives. Thoughtful features, such as drag-and-drop chart building, help your organization maintain transparency across projects.
Whether you’re seeking top-line stats or deeper trend analysis, Looker Studio aligns visualizations with the exact scope you choose.
Zoho Analytics

Zoho Analytics creates a unified environment that ties all aspects of your saas product into one framework.
It follows best practices for data integration, allowing you to build customizable dashboards that highlight the total number of subscribers and other variables critical to strategic decisions.
With advanced saas analytics and predictive analytics, you can watch for shifts in demand or usage before they influence your bottom line.
The interface aggregates payment processes, feature usage, and support logs in a single view so teams can close feedback loops more efficiently. This streamlined approach offers a consistent look at your progress and internal processes alike.
Atlassian Analytics

Atlassian Analytics merges data from Google Sheets and Google Analytics into a consolidated overview of performance during any given period. You can segment your customer base to see which activities produce the best business performance.
Whether your team has years of experience with data or is new to it, the platform also connects with Looker Studio for extended deep dives.
Teams track tasks, backlog, and root causes of delays in one interface, reducing the need to jump across different apps. This centralized approach brings shared visibility to everything from project sequences to product roadmap execution.
Klipfolio

Klipfolio emphasizes key features like real-time dashboards and lets you try them with a free trial. Its analytics pinpoint where customer behavior shifts, ensuring your business objectives remain aligned with customer needs.
You gain a clear picture of acquisition costs and can evaluate user engagement from each data source at a glance.
Klipfolio’s layout eases the steps of building visual breakdowns, so you can quickly share them with your team or clients. This collaboration helps everyone gauge the health of your brand and focus resources where they matter most.
Sisense

Sisense helps identify your target audience and see how potential customers progress through your marketing efforts.
Its analysis alerts you to a high churn rate among particular segments so you can take measures to protect your cash flow. You also get clarity on the amount of money each channel contributes, guaranteeing accurate reporting for stakeholders.
By handling large datasets, Sisense streamlines connections between sales, product usage, and customer satisfaction figures. This level of detail helps you spot missing links in your funnel and shape your retention playbook at the earliest signs of trouble.
Tableau

Tableau supports interactive dashboards that keep your data accurate across the sales funnel. You can examine any financial metric or track how small changes in customer interactions influence business goals.
The system calculates average purchase value and average customer lifespan, enabling your team to refine feature sets or aim new marketing at high-value users.
With layered visual stories, you can share the big picture across departments and make data-backed decisions quickly. Its resources suit organizations of any size aiming to harness analytics for planning product rollouts or expansions.
Power BI
Power BI organizes the metrics you might import from Zoho analytics or other platforms into clear data visualization. Many consider it among the best saas solutions for reporting without driving up the total cost of infrastructure.
It draws multiple spreadsheets into a single window that sums the total amount of money generated in a chosen time frame, making it easy to manage sales expenses in real time. You can bring together leads, product usage, and financials to see if your brand is on target.
Because of its compatibility with Microsoft products, Power BI tends to integrate quickly into most workflows.
SaaS Reporting Best Practices

- Define Your Key Metrics and KPIs: Prioritize the metrics that speak directly to your business goals. If you’re concerned about high churn, then churn rate, net promoter score, and average customer lifespan should headline your reports. If your aim is boosting recurring revenue, monthly recurring revenue, and annual recurring revenue will be prominent.
- Consolidate Data From All Sources: An accurate view comes from merging numbers in a centralized location. Whether you track user engagement via Google Analytics, marketing campaigns in Hubspot, or someone manually updates spreadsheets in Google Sheets, unify those sources to streamline your process. This step guarantees accurate data.
- Use Data Visualization For Clarity: A chart that highlights changes in churn rate or monthly recurring revenue is often more effective than reading lines of text. Well-designed visuals can immediately point out spikes or dips in your high churn rate. This is why data visualization is key for quickly capturing attention and leading to timely corrective moves.
- Automate Reporting For Efficiency: Automation removes much of the manual labor. Many best SaaS solutions, from Zoho Analytics to Looker Studio, have scheduling options that email or message updates to relevant team members. Because your raw data automatically updates, you reduce rework, and your leadership remains well-informed.
- Regularly Review and Adjust KPIs: Your product, target audience, and marketing strategies evolve. Revisit your metrics to confirm they’re still aligned with your primary business objectives. You might need to track new metrics if you add a new customer segment or pivot your SaaS product to additional markets.
- Prioritize Data Security: Take steps to protect user data. By implementing secure authentication and role-based access for your reporting tool, you maintain user trust. Many SaaS companies gather a large amount of money in subscription fees from a robust customer base, so ensuring privacy and compliance is non-negotiable.
FAQ’s:
What is The Difference Between SaaS Reporting and Traditional Reporting?
SaaS reporting focuses heavily on recurring revenue metrics, subscription-based data, and user engagement for cloud-hosted products.
Traditional reporting may center more on one-time sales and offline transactions. The continuous nature of a SaaS model generally requires more frequent updates and attention to metrics like monthly recurring revenue, churn rate, and customer lifetime value.
Can Small Businesses Benefit From SaaS Reporting Tools?
Yes. Even if you have a smaller customer base, tracking the right metrics can reveal patterns in user behavior and highlight fast fixes for revenue growth. Many solutions offer a free trial and can scale with your business, easing the transition as you grow.
How Often Should I Review My SaaS Reports?
Most businesses benefit from a monthly review for items like churn rate, new customer acquisitions, and monthly recurring revenue. But if you run intensive marketing campaigns or foresee spikes in user engagement, you might adopt weekly or even daily reviews for certain metrics.
Are There Free SaaS Reporting Tools Available?
Some providers do offer free tiers with limited functionality.
Tools like Google Analytics and Looker Studio might be suitable if you’re on a tight budget. However, for more advanced analytics—such as predictive analytics or complex dashboards—premium or enterprise plans typically deliver deeper capabilities.
Conclusion
SaaS reporting is the lifeline for modern subscription-driven companies. It consolidates data from multiple sources, including user behavior analytics and financial KPIs, to power strategic decisions.
Monitoring monthly recurring revenue, annual recurring revenue, and key user engagement metrics helps you detect issues early, plan new features, and target specific marketing strategies.
With years of experience studying SaaS companies at VH Info, we understand how vital accurate reporting is to success.
Using a robust reporting tool, setting up customizable dashboards, and ensuring your entire team has access to reliable data can help you maintain steady revenue growth, reduce churn, and build a thriving SaaS business in the long run.
 Share
Share