If you use Google Analytics, you have probably heard about bounce rate. For years, it was a key number that showed how many people left your website after looking at just one page.
But with the new version of Google Analytics, called GA4, things have changed. Many digital marketers were confused when they couldn’t easily find the bounce rate metric. Instead, Google introduced a new metric: engagement rate.
This shift has led to many questions. What is the new bounce rate GA4 metric? How does it work? And is it still important for your digital marketing strategy?
At VH-info, we help SaaS companies make sense of data to improve their website’s performance. This guide will explain everything you need to know about bounce rate in GA4. We will break down what it is, how it’s different from the old Universal Analytics metric, and how you can use it to get actionable insights into your user engagement. We want to give you a clearer picture of your user behavior.
What is Bounce Rate in Google Analytics?
The meaning of bounce rate has changed in GA4. It is now directly connected to engagement rate, which measures positive user interaction. Let’s look at the official definition.
Bounce Rate Definition in Google Analytics 4
In GA4, the bounce rate definition is very simple: it is the percentage of sessions that were not an engaged session. A session is the period of time a user is active on your site.
So, if a visitor comes to your site and leaves without interacting in a meaningful way, that session is counted as a bounce.
The definition of bounce rate in GA4 is clearer than before. It focuses on the lack of user engagement, rather than just looking at if someone visited a single page. This helps you better judge your website’s performance.
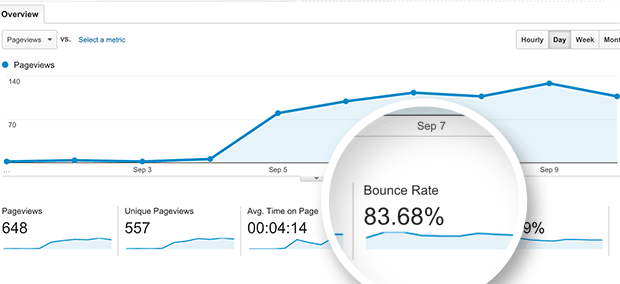
What Was the Bounce Rate in Universal Analytics (UA)?
In the old Universal Analytics (UA), the bounce rate calculation was different. A bounce was counted any time a person visited one page on your site and then left without clicking on anything else. These were called single-page sessions.
This created problems. Imagine someone lands on your blog from a Google search. They read your entire article for five minutes, find the answer they needed, and then close the tab.
In Universal Analytics, this was a bounce. This could lead to a high bounce rate, even if your content was very helpful. It did not give a good picture of the actual user experience or user activity. It was a common issue with the old bounce rate metrics.
The Big Shift: From Bounce Rate to Engagement Rate in GA4
Google knew the old bounce rate metric was flawed. That’s why they shifted the focus to a new, more positive measurement in GA4: engagement rate.
Why Google Moved Away From Session-Based Metrics?
The old metric in UA didn’t tell the whole story. It punished websites for having effective single-page content that gave users everything they needed quickly. Google wanted a better idea of what users were doing on a site. They needed a new metric that showed positive user interaction, not just a quick exit. This shift helps measure content relevance more accurately.
Introducing “Engaged Sessions”: A More Positive Measurement
Instead of focusing on negative actions (bounces), GA4 focuses on positive ones. This is where the engaged session comes in. An engaged session is a visit where the user actively shows interest in your website.
This is a much better way to measure user engagement because it rewards you for keeping a visitor interested, even if they stay on one page. It provides a better look at your website’s bounce rate in a new light.
What is Engagement Rate in GA4?
Engagement rate is now a primary metric in GA4. It is the main way to measure how well your website keeps visitors interested.
The Official Definition: How GA4 Defines an Engaged Session?
The official definition is straightforward. Engagement rate is the percentage of total sessions that were an engaged session.
So, if you had 100 sessions and 70 of them were engaged, your engagement rate would be 70%. These engagement metrics give you a clear view of your website’s health.
The 3 Criteria For Engagement (Duration, Conversion, Or Pageviews)
So, what makes a session “engaged“? A visit becomes an engaged session if the user does one of these three things:
- Stays on your website for more than 10 seconds. This is the default engagement time, but it can be changed in your settings with Google Tag Manager.
- Triggers a conversion event. A conversion event is an important action you want users to take, like signing up for a newsletter or making a purchase.
- Looks at more than one page (has at least one additional page view).
If a user does any of these, GA4 counts it as positive user activity. The average engagement time is another useful metric to watch alongside this.
Why Engagement Rate Provides Deeper User Insights?
Engagement rate gives digital marketers a much better picture of website’s performance. A high engagement rate shows that your content is interesting, your site is easy to use, and you are meeting user needs. It helps you see which pages and traffic sources are bringing in the most interested visitors. This provides truly actionable insights into user behavior, which the old bounce rate could not do as well.
So, Does Bounce Rate Exist in GA4?
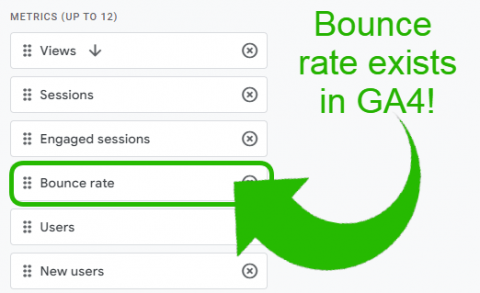
With all this talk about engagement rate, you might wonder if bounce rate is gone for good. The good news is, it’s still here.
Yes, But It’s Calculated Differently
You can still find bounce rate in GA4, but it’s not shown by default in most reports. More importantly, the bounce rate calculation is entirely new. It is no longer about single-page sessions. The new bounce rate is now based on engagement.
How GA4 Calculates Bounce Rate (The Inverse of Engagement Rate)
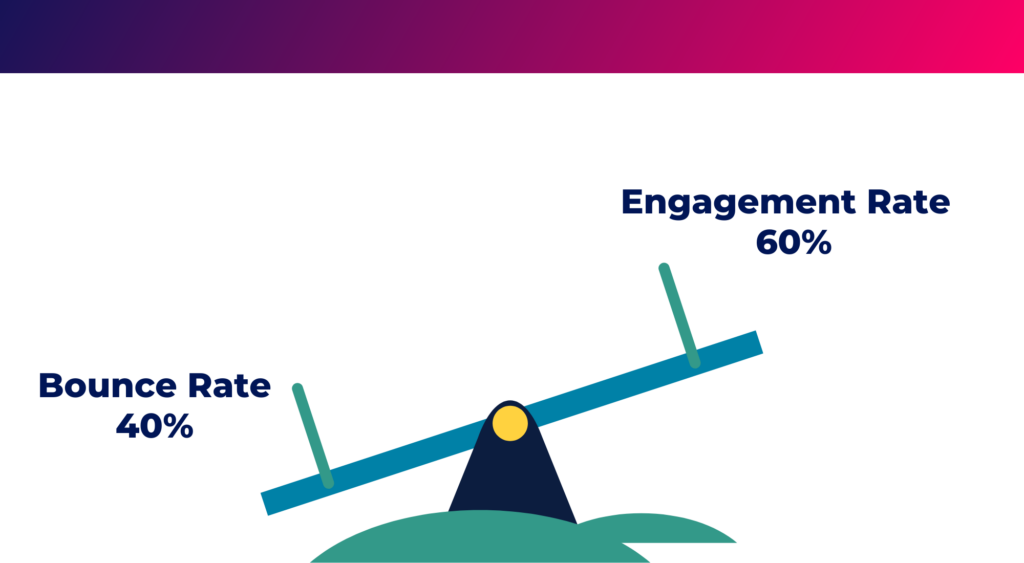
The new bounce rate calculation is very simple: it is the inverse of the engagement rate. This means it is the opposite of your engagement rate.
Here is the formula: Bounce Rate = 100% – Engagement Rate
So, if your engagement rate is 80%, your bounce rate ga4 is 20%. This direct link makes the two metrics two sides of the same coin. A low bounce rate means a high engagement rate, which is what you want.
A Practical Example: UA Bounce Rate Vs. GA4 Bounce Rate
Let’s look at an example to see the difference.
- Scenario: A user clicks on your landing page from a Google Ads campaign. They spend two minutes reading the content but don’t click on any other pages before leaving.
- In Universal Analytics: This was a bounce. The user interaction was not counted, and it would contribute to a high bounce rate.
- In GA4: Because the user stayed for more than 10 seconds, this is an engaged session. Therefore, it is not a bounce. This shows a much better picture of user engagement. The new bounce rate gives you a more useful number.
How to Find and Analyze Engagement & Bounce Rate in GA4?
GA4 is a powerful tool, but you need to know where to look to find the right data. While engagement rate is easy to find, you have to do a little work to see your bounce rate.
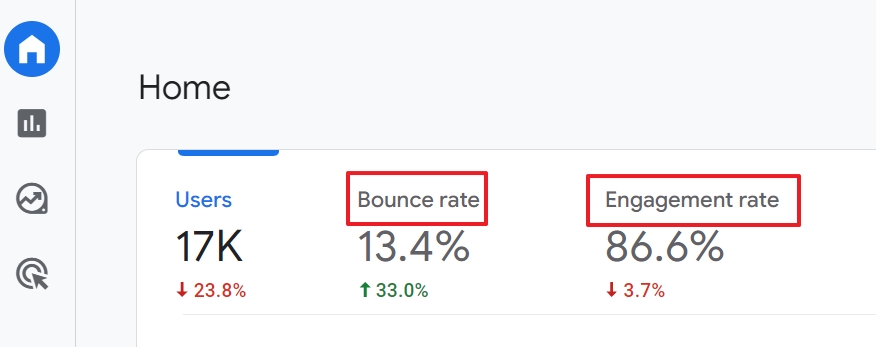
Finding Engagement Rate in Standard GA4 Reports
Engagement rate is included in many standard GA4 reports.
For example, you can find it in the Traffic Acquisition report. This report shows you where your users are coming from. You can easily compare the engagement rate from different sources, like organic search, social media, or email campaigns.
The report data is available right away.
How to Add Bounce Rate to Your GA4 Reports?
If you want to find bounce rate and add it to your reports, you need to customize report settings. It’s easy to do.
- Go to a report, like the “Pages and screens” report.
- In the top right corner, click the pencil icon. This lets you edit the current report.
- In the menu that appears, click on “Metrics.”
- Click “Add metric” and start typing “Bounce rate.” Select it from the list.
- You can drag and drop it to where you want it to appear in the table.
- Click “Apply” and then “Save” the changes to the current report.
Now, bounce rate will appear in that report every time you view it.
Analyzing Engagement by Channel, Landing Page, and Audience
Once you have the data, you can analyze your website’s performance. Look at which channels have the highest engagement rate. Is traffic from Google Ads more engaged than from Facebook? Check which landing page has the lowest bounce rate.
This can tell you which pages are doing a great job. Analyzing this report data helps you make better decisions.
Strategies to Improve Engagement Rate (and Lower Bounce Rate)

Your goal should be to increase user engagement, which will naturally lower your bounce rate.
Here are some strategies that we at VH-info recommend to our SaaS clients.
- Optimizing Content For User Intent and Quality: Make sure your content directly answers the questions your visitors have. The content relevance is key. If a user searches for something specific and your page delivers the answer, they are more likely to stay. Use clear headings, short paragraphs, and helpful images to improve the user experience.
- Improving Page Load Speed and Core Web Vitals: Nobody likes a slow website. If your pages take too long to load, visitors will leave before they even see your content. A fast site is essential for a good user experience and a low bounce rate.
- Enhancing Internal Linking and Clear Calls-to-Action (CTAs): Guide your visitors to other useful pages on your site. This encourages them to get a second page view, which automatically makes their visit an engaged session. Also, tell users what to do next with clear CTAs like “Sign Up for a Free Trial” or “Contact Us for a Demo.” This can lead to a valuable conversion event.
- Ensuring Your Website is Mobile-Friendly: Many of your visitors will be using a phone or a mobile app. Your website must look good and be easy to use on a small screen. A poor mobile experience is a common reason for a high bounce rate.
FAQ’s:
How Reliable is Bounce Rate in GA4 Compared to Traditional Analytics?
The bounce rate in GA4 is more reliable for showing a true lack of engagement. The old bounce rate metrics in Universal Analytics were often misleading because they counted engaged readers as bounces. The new bounce rate in this version of Google Analytics provides a clearer picture of user interaction, making it a more trustworthy metric for web analytics.
Can Bounce Rate in GA4 Help Improve Conversion Rates?
Yes. Analyzing your website’s bounce rate can help you spot problems. For example, if a critical landing page has a high bounce rate, you know there’s an issue. It could be slow load times, confusing content, or a broken button. Fixing these problems can improve user engagement and encourage more users to complete a conversion event, boosting your conversion rates.
Is Bounce Rate Still A Relevant Metric For Modern Website Analysis?
While engagement rate is now the main focus, bounce rate is still a useful metric. It’s a good idea to look at it along with other engagement metrics, like average engagement time.
The average bounce rate across your site, which you can calculate from the total number of sessions, can give you a quick check on your site’s health. Knowing what is a good bounce rate in GA4 (often much lower than in UA) can help you set performance benchmarks.
A good bounce rate is a positive signal.
Conclusion
The shift from the old bounce rate in Universal Analytics to the new engagement rate in GA4 is a big step forward for web analytics. The new metric system offers a more meaningful way to measure user engagement and your website’s performance.
Remember, the bounce rate GA4 is now simply the inverse of engagement rate.
Concentrating on delivering an excellent user experience, offering pertinent content, and promoting user engagement will inherently enhance your engagement rate and lead to a reduced bounce rate. Such metrics serve as a significant asset for any business.
At VH-info, we specialize in building strategies that not only drive traffic but also keep users engaged. Understanding your analytics is the first step. Using these actionable insights to improve your digital marketing efforts is how you grow.

 Share
Share