In planning, it is important to look at the total market. You also need to find the serviceable obtainable market (SOM).
This helps you target the right customers. Knowing your obtainable market size helps you use your resources well. It also helps you improve sales plans and focus on marketing.
For SaaS link-building agencies, calculating SOM is key. This way, your team can focus on a realistic part of the market. This maximizes how much money you can make. It also guides how you invest in your business.
What Is Serviceable Obtainable Market?

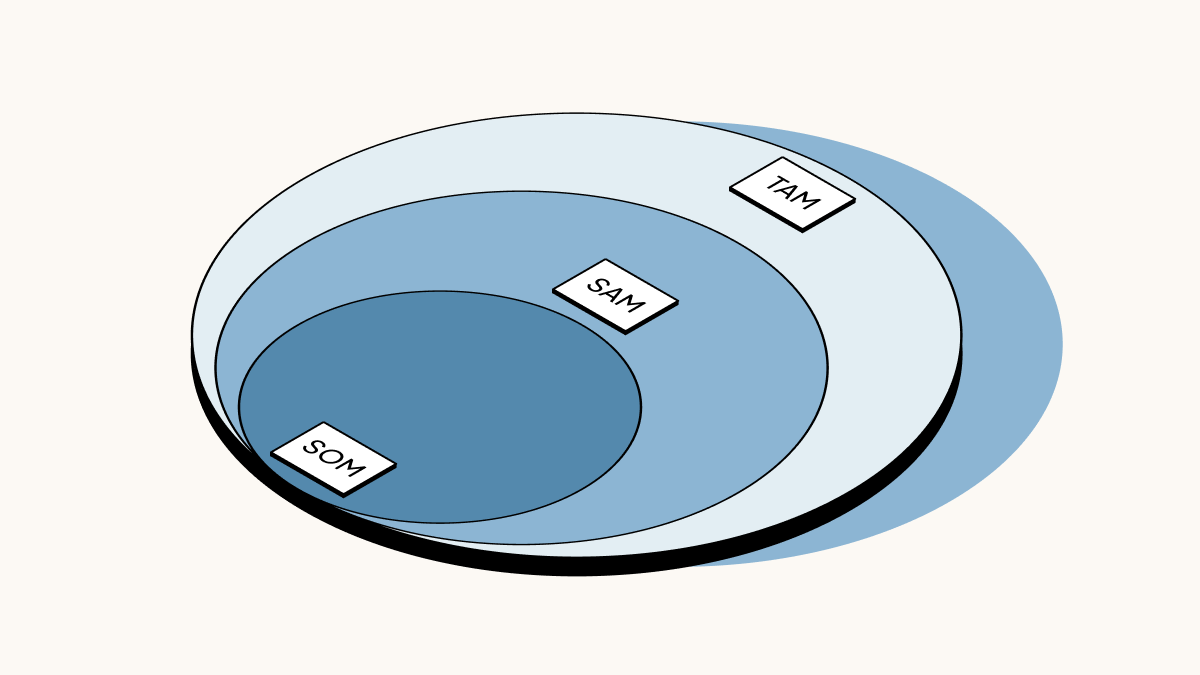
Serviceable obtainable market, or SOM, is the part of the serviceable addressable market (SAM) that your business can reach.
It looks at how well you can distribute your product. It also considers where you can sell, how much you can make, and what makes you better than others. This helps to find possible customers in your target area.
Unlike total available market, SOM shows the share you can get in a specific segment or new areas.
Why Serviceable Obtainable Market Matters For Businesses?

Estimating the Serviceable Obtainable Market (SOM) helps align marketing and sales plans with real market needs. It stops companies from thinking the market demand is too high. This also sets practical goals for how much money they can make.
By using SOM for decisions, businesses do not waste money on the wrong market areas.
For link-building services, SOM reports show your agency’s share of total revenue in SaaS link-building. This information tells clients what to expect in yearly revenue and how their brand can grow.
How to Calculate the Serviceable Obtainable Market?
A straightforward serviceable obtainable market formula:
SOM = Total Addressable Market × Serviceable Available Market Percentage × Market
- Total Addressable Market (TAM): total market demand or total number of potential customers for your particular product or service.
- Serviceable Available Market (SAM): portion of TAM reachable given geographic location, distribution capabilities, and marketing efforts.
- Realistic Market Share: expected percentage of SAM you can capture based on the competitive landscape and historical performance.
For example, if TAM is 10,000 potential customers, your SAM is 4,000 (40%), and you estimate a 10% market share, then SOM equals 400 customers.
Factors That Affect SOM

Market Size and Reach
Market size means the total number of potential customers in your total addressable market, while reach is how many of those you can contact or serve. A larger total market and wider geographic reach increase your serviceable available market, giving you more room to grow your serviceable obtainable market.
But you must consider your distribution capabilities and marketing efforts—if you can’t deliver or promote to certain regions, those potential customers stay out of reach.
Realistic market data and market reports help you map where you can compete effectively and set achievable goals for market share.
Product
Your particular product’s features, quality, and pricing shape how customers choose you over similar products. A strong product that fits customer needs boosts brand awareness and customer base, helping you win a bigger slice of your serviceable obtainable market.
Conversely, if your product lacks key features or clear value, your average annual revenue and total revenue opportunity shrink because customers turn elsewhere.
Always align product improvements with market demand and use external research on similar products to guide enhancements.
Competition
The competitive landscape determines how much serviceable addressable market you can capture.
If many companies offer similar solutions, your realistic market share percentage shrinks, limiting your SOM. Assess competitors’ strengths—like distribution networks, marketing strategy, and pricing—and identify your competitive advantage to stand out.
Detailed market analysis and competitive reports help you see where rivals are weaker so you can focus sales strategies and distribution capabilities on underserved segments.
Historical Performance and External Research
Your historical performance—past sales data, customer acquisition cost, and churn rate—reveals how well you’ve converted SAM into SOM.
Strong past growth suggests you can maintain or expand your serviceable obtainable market; poor performance signals a need for strategy shifts. Complement this with external research and market data from credible market reports to validate assumptions about market potential and average revenue per customer.
Together, these insights help you set realistic goals and refine your business strategy for better market share.
Distinguishing Between TAM, SAM, and SOM
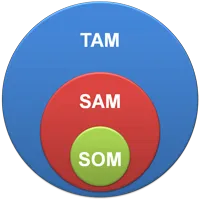
Comparison of TAM, SAM, and SOM
| Metric | Definition | Purpose | Scope | Key Inputs |
|---|---|---|---|---|
| Total Addressable Market (TAM) | Total market demand for an entire market or all potential customers | Identifies total revenue opportunity | Entire market, global market | Market size data, total demand reports |
| Serviceable Available Market (SAM) | Portion of TAM reachable by your distribution and geographical reach | Focuses marketing strategy on attainable market segments | Specific market or region | Distribution capabilities, marketing efforts |
| Serviceable Obtainable Market (SOM) | Share of SAM your business can capture (market share) | Guides realistic sales forecasts and investment decisions | Target market segment | Competitive advantages, historical performance |
Real-World Examples of Each Market Type
- TAM: All SaaS companies worldwide needing link-building services—potential revenue over $10 billion.
- SAM: SaaS startups in North America and Europe with annual revenue above $1 million—market size of $1 billion.
- SOM: VH Info aims to capture 5% of SAM, equal to $50 million in revenue potential.
Serviceable Obtainable Market Across Industries

The idea of SOM is useful in many industries which are as follows:
Retail
In retail, serviceable obtainable market (SOM) is the slice of the serviceable available market (SAM) you can reach through your stores or online channels. It starts with the total addressable market (TAM) for a product category—say, all shoppers interested in organic snacks—and narrows to regions where your distribution capabilities and geographical reach let you sell.
Then you factor in your competitive advantage—such as exclusive flavors or loyalty programs—to estimate the share you can realistically capture. Clear market research and historical performance data help set a realistic market share target.
This guides your marketing strategy and highlights how many potential customers you can convert into buyers.
SaaS
For SaaS companies, SOM measures the portion of the serviceable addressable market they can win based on their product’s fit, pricing, and competitive landscape. You begin with the TAM of all businesses needing your type of software, trim to those within your target market—for example, small firms with budgets matching your pricing—and then apply your expected market share percentage.
Factors like your software’s unique features, customer base, and ability to support users in various geographical locations shape your SOM. Using external research on similar products and past subscription growth lets you project how many customers you’ll likely sign up and what revenue potential that represents.
Healthcare
In healthcare, SOM identifies the number of hospitals, clinics, or patients you can serve with your medical device or service.
Start with the TAM of all organizations needing that device, refine to those in regions where you have regulatory approvals and a distribution network—your SAM—and then estimate the realistic share you’ll capture based on production capacity and competitive advantage.
Clinical trial results, market reports, and your historical performance inform this share.
A clear understanding of market demand, reimbursement rates, and partnerships with healthcare providers further clarifies how many potential customers you can reach and the total revenue opportunity you can obtain.
Strategic Considerations For Optimizing Your SOM

Expanding Company Capabilities
Boosting your company’s production capacity and improving distribution capabilities widens your serviceable available market, which in turn grows your serviceable obtainable market.
By investing in new technology or hiring skilled teams, you increase your total revenue opportunity and serve more potential customers. Expanding geographic reach through additional warehouses or remote support helps tap into untapped market segments.
Strong internal processes and scalable operations create a reliable foundation for capturing a larger share of the market. This approach aligns with your business strategy and marketing efforts to maximize market share.
Competitive Advantages
Identifying and strengthening your unique strengths—such as superior product features, branded tools, or exclusive partnerships—lets you stand out in a crowded market.
A clear competitive advantage improves brand awareness and convinces more of your target market to choose you over similar products.
By emphasizing what makes your offering distinct, you can boost your market potential and raise your realistic market share percentage. Regular market analysis and external research help reveal where rivals are weak and where you can gain ground.
This focus on differentiation directly increases your potential revenue and attainable portion of the TAM.
Market Development
Entering new markets or launching new products expands your total addressable market and grows your serviceable addressable market.
Whether it’s introducing your SaaS link-building service to a different industry or targeting a new geographic location, market development diversifies your revenue streams.
Conduct thorough market research and use market reports to assess demand, customer base size, and average annual revenue potential in each segment. Align production capacity and marketing strategy with the specific market segment to ensure you can serve those customers.
Gradual expansion with clear goals keeps your SOM growth realistic and sustainable.
Collaborative Partnerships
Forming alliances with complementary businesses or industry influencers extends your distribution capabilities and broadens your geographic reach.
Partnerships let you tap into an existing customer base and share market data, reducing customer acquisition cost and accelerating growth. Joint marketing efforts, co-branded campaigns, or integrated services can boost your brand awareness and serviceable available market.
By aligning with trusted partners, you strengthen your competitive advantage and increase the number of potential customers you can realistically capture. Collaborative partnerships support strategic decisions and investment decisions to drive higher market share.
Remaining Nimble In A Changing Market
Staying flexible and responsive to shifts in market demand keeps your SOM aligned with real opportunities.
Regularly revisit your SOM calculation, updating market size estimates, production capacity, and competitive landscape insights based on fresh external research.
Adjust your marketing efforts, pricing, or distribution strategy when new competitors emerge or customer preferences change.
A nimble approach ensures you don’t miss out on emerging trends or new business segments. This adaptability secures your place in the evolving market landscape and maintains growth in your serviceable obtainable market.
Using SOM With Other KPIs

Using SOM alongside other KPIs gives you a clear view of your market potential and business health.
First, compare your serviceable obtainable market to your actual customer base to see how much of your available market you’ve captured. Then track customer acquisition cost and average annual revenue per customer to understand if you’re spending wisely to grow your SOM.
Monitor churn rate and market share percentage to spot when you’re losing ground in your target market. Combine SOM with production capacity and marketing efforts metrics to ensure you can fulfill demand as you win more of the TAM.
Finally, use these insights for smart strategic planning, refining your sales strategies and investment decisions to boost your total revenue opportunity.
FAQ’s:
Why is SOM an Important Metric For E-Commerce?
SOM shows the part of the total market that your online store can reach. This depends on your ability to distribute and your marketing work. It helps online brands make clear sales plans. It also helps them avoid wasting money on unfit parts of the market.
This way, they can get a better return on their investment. It also helps them grow their share in the market.
What is the Relationship Between SOM, TAM, and SAM?
Total addressable market (TAM) is the entire potential customer base for a product.
Serviceable available market (SAM) narrows TAM to the segment your business can reach given its geographic reach and distribution capabilities. SOM then refines SAM further by estimating the share you can realistically capture as market share.
How Often Should SOM Be Re-Evaluated?
Check your SOM numbers at least every three months. Do this whenever you enter new markets, launch new products, or see changes in competition. Regular updates with new market data are important. They help keep your serviceable obtainable market in line with actual needs.
What Are Some Limitations Of Using SOM As A Metric?
SOM depends on a strong market study. It also needs clear ideas about market share. If the input is too hopeful, it can cause issues. Old data can also lead to mistakes. This may mislead plans for strategy. It can result in wrong guesses for income. It may also waste resources.
How Can You Improve Your SOM?
Boost your serviceable obtainable market. You can do this by improving how you distribute your products. It is also important to reach more places. You should work on making your business stand out. When you invest in better products, it helps too.
Focus on targeted marketing efforts as well. This will grow your serviceable available market. It will help you gain a bigger share of the market.
Is Certification Necessary to Calculate SOM?
You do not need a certificate to find out your SOM.
Still, having good skills in market research is helpful. You should also know how to analyze data well. Being familiar with market reports can make a big difference. Using outside research helps too. These skills will help you get accurate and useful SOM estimates.,
How Does SOM Affect Sales Forecasts?
SOM helps sales forecasts by using real numbers. It shows the part of the market you can reach. This guides how to spend money on marketing and plan for production. It also helps set goals for sales. This improves how much money you can make overall.
Can Improving the Quality of a Product Or Service Increase SOM?
Yes. Improving product features helps attract more customers. Better customer service also makes clients happy. When you are reliable, people trust your brand more. All these factors raise your market share in the serviceable addressable market.
This, in turn, boosts your serviceable obtainable market.
Can Partnerships Help In Optimizing SOM?
Collaborative partnerships help you reach more places and more people. They improve your ability to share products.
By working with trusted partners, you can share market data. This helps lower the cost of getting new customers. You also increase the number of potential customers you can attract.
Conclusion
Getting the serviceable obtainable market right is key to smart business planning and long-term success.
By figuring out the realistic portion of your serviceable addressable market that you can capture, you set achievable goals and use your resources wisely.
SOM calculation helps you make better strategic decisions by showing what’s actually possible instead of just hoping for the best. This approach guides your marketing strategy and sales strategies to focus on the most promising potential customers within your target market.
When you regularly check your market share and adjust your SOM based on fresh market data and competitive landscape changes, you stay ahead of the game. Whether you’re a startup or an established business, using SOM alongside other important metrics like customer acquisition cost and average annual revenue gives you a complete picture of your market potential.
With the right distribution capabilities and a clear competitive advantage, you can grow your serviceable obtainable market and increase your total revenue opportunity. Remember, successful businesses use SOM to make smart investment decisions and build strategies that match their real abilities in the given market.


 Share
Share